Fixing the blind spot in multi-cloud network observability
A new guide details how to instrument the space between cloud providers, emphasizing normalized logs, synthetic probes, and strict clock synchronization.
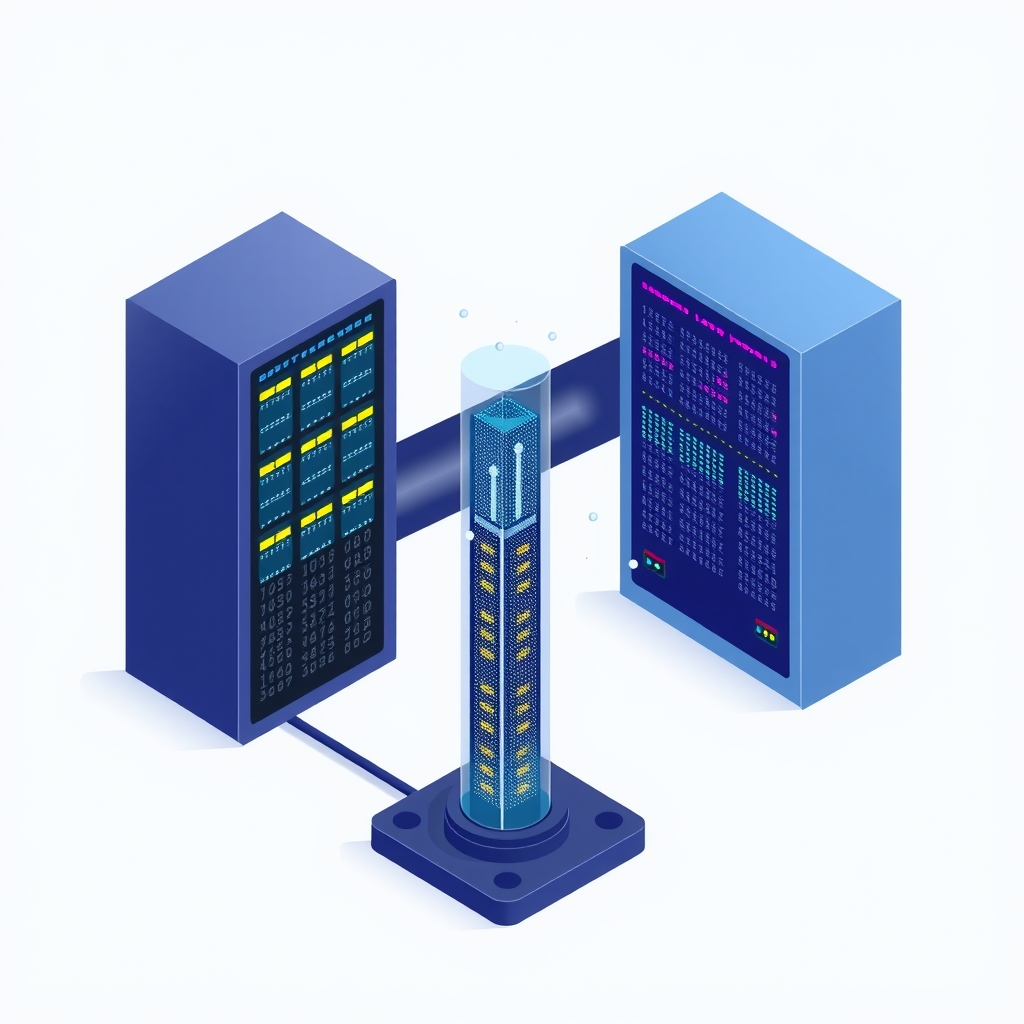
Multi-cloud environments often suffer from a critical visibility gap located strictly between service providers. A recent technical analysis highlights that while internal metrics within AWS or Azure remain robust, the transit path connecting them frequently lacks ownership or monitoring. This blind spot causes significant troubleshooting delays when cross-cloud requests degrade, as each provider reports healthy status despite the end-to-end failure.
What happened
The article, published on November 9, 2026, by OneLifeVibe on DEV Community, argues that observability strategies must evolve to treat the interconnect as a first-class measurable entity. The core issue is not a lack of data, but a fragmentation of data formats and a lack of correlation across boundaries. When a packet leaves one cloud and enters another, it passes through a network segment that often belongs to no specific dashboard. Consequently, engineers face a scenario where both sides report truthfully that their local infrastructure is functional, yet the user experience suffers.
The author posits that solving this requires more than purchasing additional monitoring tools. It demands a disciplined approach to naming, instrumenting, and probing the specific paths used by production traffic. The guidance focuses on making the cross-cloud journey visible to the engineer on call at any hour, transforming vague connectivity issues into concrete, actionable data points. This shift moves teams from reactive archaeology to proactive evidence-based debugging.
Key details
- Normalize data at collection: Teams should translate provider-specific flow logs into a common record format containing source, destination, ports, bytes, and timestamps before storage to avoid manual translation during outages.
- Understand sampling limitations: Flow logs are often sampled and may drop records under load; absence of evidence in these logs does not prove a path was unused.
- Synchronize clocks strictly: Cross-cloud correlation fails if timestamps disagree, so maintaining disciplined NTP and time zone consistency is foundational infrastructure work.
- Probe the real private path: Synthetic probes must travel over the private interconnect to private endpoints, measuring latency and loss on the actual route rather than public internet shortcuts.
- Separate path alerts: Network path alerts should be distinct from application alerts to immediately answer whether the issue lies in the network or the software.
- Log NAT translations: Address translations at gateways must be recorded as first-class events to resolve mismatches where source addresses are rewritten between clouds.
Background
To understand the challenge, one must recognize how cloud providers handle network telemetry. Services like VPC flow logs or NSG flow logs capture metadata about IP traffic, but they do so with varying levels of granularity and delay. Some providers sample traffic, meaning they only record a fraction of packets, while others may delay log availability by minutes. Furthermore, when traffic crosses from one provider to another, network address translation (NAT) often changes the source IP, breaking simple correlation methods based on IP addresses alone.
Observability in this context refers to the ability to infer the internal state of a system from its external outputs. In a single-cloud setup, this is straightforward because the vendor provides unified tools. In a multi-cloud setup, the "system" includes the private interconnects—such as Direct Connect or ExpressRoute—which are managed differently and often lack the deep introspection available within a single vendor's ecosystem. This creates a "dark" zone where packets exist but are not effectively tracked.
Why it matters
For teams running self-hosted software across multiple providers, this blind spot directly impacts mean time to resolution (MTTR). Without clear visibility into the interconnect, engineers waste valuable time determining whether a slowdown is caused by their application code, the database, or the network pipe. The article notes that aggregate metrics can hide severe tail-latency issues, such as a nine-minute stall that averages out to look normal. By failing to track percentiles and loss rates per path, teams miss the specific symptoms of congestion or MTU mismatches that degrade performance for latency-sensitive tasks like database replication.
Moreover, the lack of standardized data leads to operational friction during incidents. If logs from different clouds use different vocabularies and timestamps, correlating them requires mental effort and manual querying that slows down response times. The article emphasizes that "incidents are not the time to assemble a mental join across consoles." Having a unified view allows teams to argue with facts rather than hypotheses, which is crucial when dealing with external providers or internal stakeholders who need quick answers.
What you can do
- Implement a common log schema: Define a standard record structure for network flows and build pipelines to translate provider-specific logs into this format immediately upon ingestion.
- Deploy bidirectional synthetic probes: Set up continuous, lightweight traffic generators that traverse the private interconnect in both directions to establish a baseline for latency and jitter.
- Audit clock synchronization: Verify that all systems across your multi-cloud estate are synchronized to the same time source and document any known skews.
- Tag paths explicitly: Ensure that every flow log entry includes a stable identifier for the specific interconnect or gateway used, not just the instance ID.
- Integrate change logs: Feed network configuration changes, such as route withdrawals or firewall updates, into the same timeline as your performance metrics to correlate events with degradations.
- Test alerting mechanisms: Regularly simulate path failures in maintenance windows to confirm that dashboards update and alerts fire as expected, ensuring reliability when real incidents occur.