Oxynote merges live metrics and documentation in one self-hosted wiki
The new open-source tool Oxynote embeds live Prometheus and SQL charts directly into documentation pages, allowing teams to review metrics and explanations together.
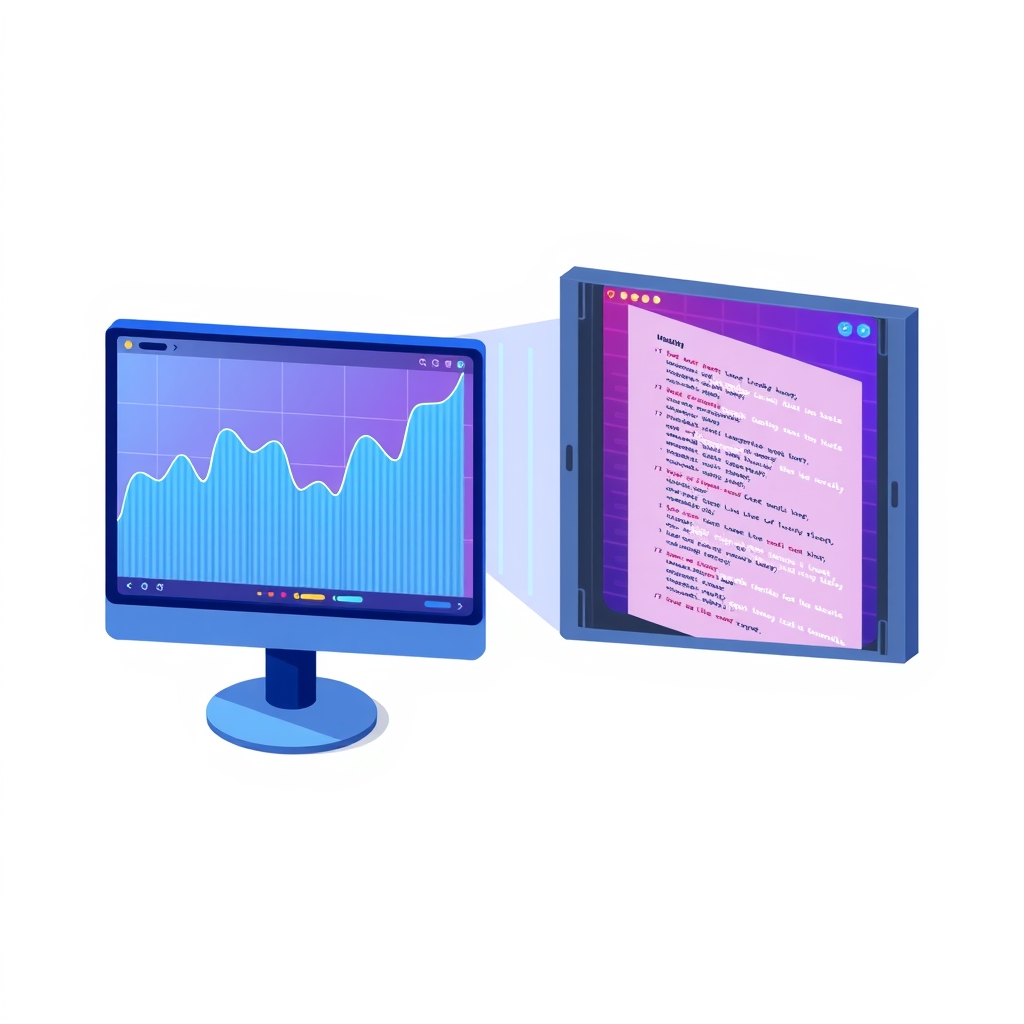
On October 13, 2026, the developers behind the ttlcache library released Oxynote, an open-source technical wiki designed to bridge the gap between system monitoring and documentation. This self-hosted platform allows engineering teams to embed live metric charts directly alongside their explanatory text, ensuring that operational context remains synchronized with visual data.
What happened
Oxynote addresses a common fragmentation problem in modern DevOps workflows where dashboards and documentation live in separate silos. Traditionally, tools like Grafana provide limited space for panel descriptions, while external wikis like Notion can only embed static or restricted views of those dashboards. This separation often leads to drift, where the explanation in a wiki no longer matches the current state or configuration of the chart it references. Oxynote solves this by executing queries for Prometheus, PostgreSQL, MySQL, and MariaDB directly within the documentation page, keeping the data and its narrative in a single, version-controlled location.
The project was born from the frustrating experiences of its creators, who found themselves relying on private Slack chats as their primary source of truth for critical system information. When services handling financial market data suffered memory leaks and outages, existing dashboards failed to highlight the root causes, forcing engineers to manually run health checks and backfill scripts. The lack of integrated documentation meant that during on-call shifts, new team members struggled to interpret complex monitoring interfaces like Datadog without clear, accessible explanations linked directly to the relevant metrics.
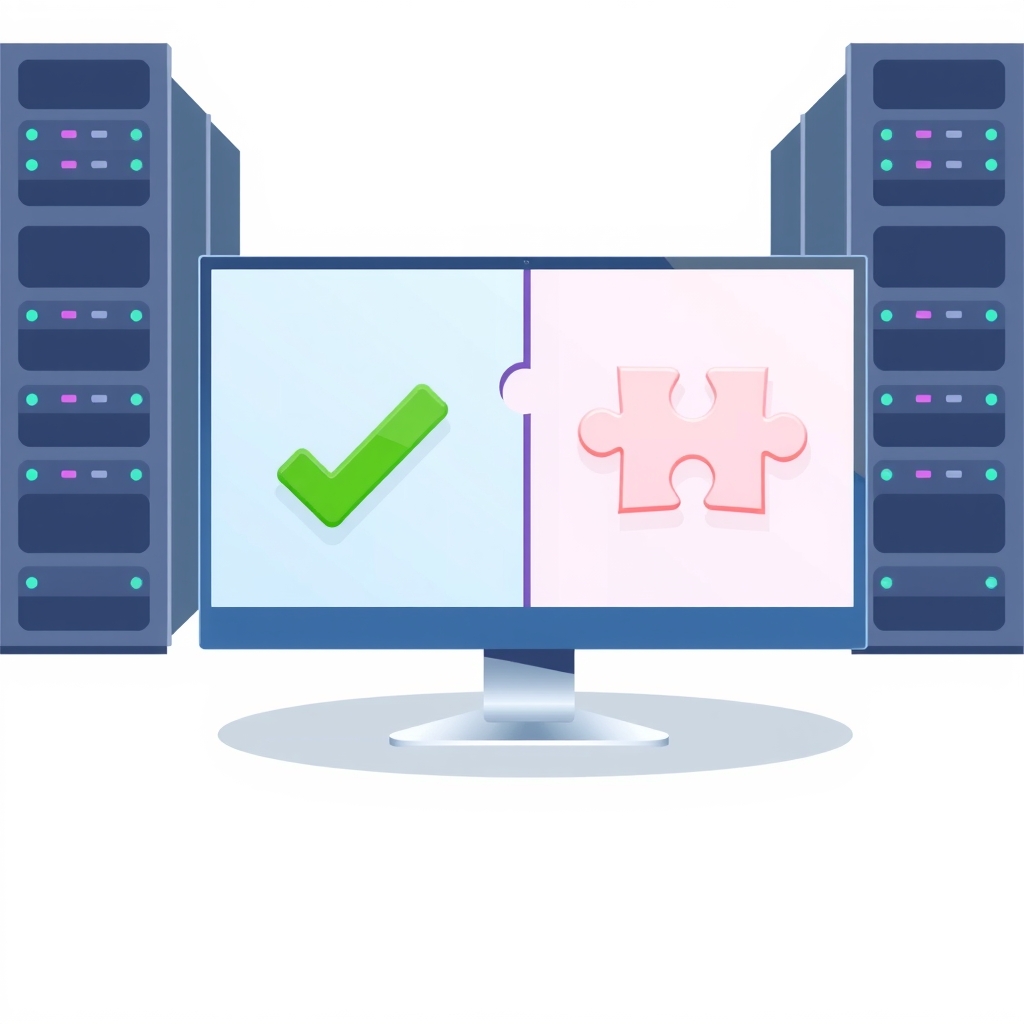
To prevent this knowledge loss, Oxynote introduces a review workflow similar to code pull requests. Changes to documentation, including updates to metric queries or threshold explanations, go through a draft phase with visual diffs. This ensures that both the technical configuration and its human-readable context are reviewed and approved together before merging into the main branch, reducing the risk of outdated or misleading operational guides.
Key details
- Live Metric Integration: Supports time series, bar charts, and gauges using queries from Prometheus, PostgreSQL, MySQL, and MariaDB.
- Unified Review Process: Changes to pages undergo a draft, diff, and approval flow that treats metric blocks and text as a single unit.
- Self-Hosted Architecture: Runs as a single container via Docker, with data persisted in a volume, requiring no external hosted service.
- Collaborative Editing: Features real-time presence indicators, block-level comments, and mentions that notify users via email.
- AI Assistance: Includes a built-in assistant called Rubber Duck that can edit pages and run queries using models from Anthropic, OpenAI, Google, or local Ollama instances.
- Freshness Hooks: Pages can track dependencies on GitHub files, container images, or dates, triggering reminders when underlying systems change.
Background
For many engineering teams, observability and documentation are managed by distinct tools that do not communicate effectively. Dashboards provide real-time visibility into system health but lack the space for detailed procedural context. Conversely, wikis offer rich text editing and historical context but cannot natively display live, query-driven data without complex embeds that often break or require separate authentication. This disconnect forces engineers to maintain mental maps of which dashboard corresponds to which documentation page, leading to errors during incident response.
Oxynote attempts to unify these layers by treating documentation as a dynamic interface rather than a static record. By embedding the query logic directly into the page, it ensures that the visual representation of system health is always tied to its explanation. This approach mirrors the concept of "docs as code," where documentation changes are versioned and reviewed with the same rigor as software changes, but extends it to include the data visualization layer itself.
Why it matters
For teams that run their own software, the speed of incident resolution often depends on how quickly an engineer can understand the current state of a system. When metrics and explanations are separated, on-call engineers waste valuable time cross-referencing tabs and verifying that the documentation they are reading still applies to the live environment. Oxynote reduces this cognitive load by presenting the graph, the explanation, and the relevant commands on a single page, making it easier for both humans and AI agents to diagnose issues accurately.
Furthermore, the tool’s review mechanism helps maintain high-quality operational knowledge. In fast-moving environments, dashboards change frequently as new labels are added or thresholds are adjusted. Without a unified review process, documentation quickly becomes obsolete, leading to confusion and potential misconfiguration. By enforcing a draft and approval workflow for both text and metrics, Oxynote ensures that the team’s shared understanding of the system evolves in lockstep with the system itself.
What you can do
- Deploy Oxynote using the provided Docker command to test its integration with your existing Prometheus or SQL databases.
- Identify critical dashboards in your current setup that lack clear documentation and migrate them to Oxynote pages with embedded queries.
- Establish a review policy for operational documentation, requiring drafts and approvals for any changes to metric thresholds or explanations.
- Use the freshness hooks to link documentation pages to specific container images or GitHub repositories, ensuring alerts when dependencies update.
- Configure the Rubber Duck assistant with a local model via Ollama if data privacy prevents the use of external AI providers.
- Evaluate whether the current split between your wiki and monitoring tools is causing onboarding delays or incident response friction.