Uptime Kuma and Beszel: Why homelab operators run both monitoring tools
A practical comparison shows Uptime Kuma checks service endpoints while Beszel tracks host resources, leading many engineers to deploy both for complete visibility.

Self-hosting enthusiasts and IT managers are increasingly pairing two distinct monitoring tools to gain full visibility into their infrastructure. Published on November 20, 2026, a detailed analysis highlights how Uptime Kuma and Beszel solve different problems, prompting many operators to run them side by side rather than choosing one over the other.
What happened
The core distinction lies in what each tool measures. Uptime Kuma functions as an external endpoint checker. It verifies whether a service responds on a specific port, URL, or DNS record by initiating connections at defined intervals. If a check fails, it logs the response time and triggers alerts through more than 90 supported platforms, including Discord, Telegram, and email. It operates independently of the target's operating system, making it ideal for confirming that applications are reachable from the network.
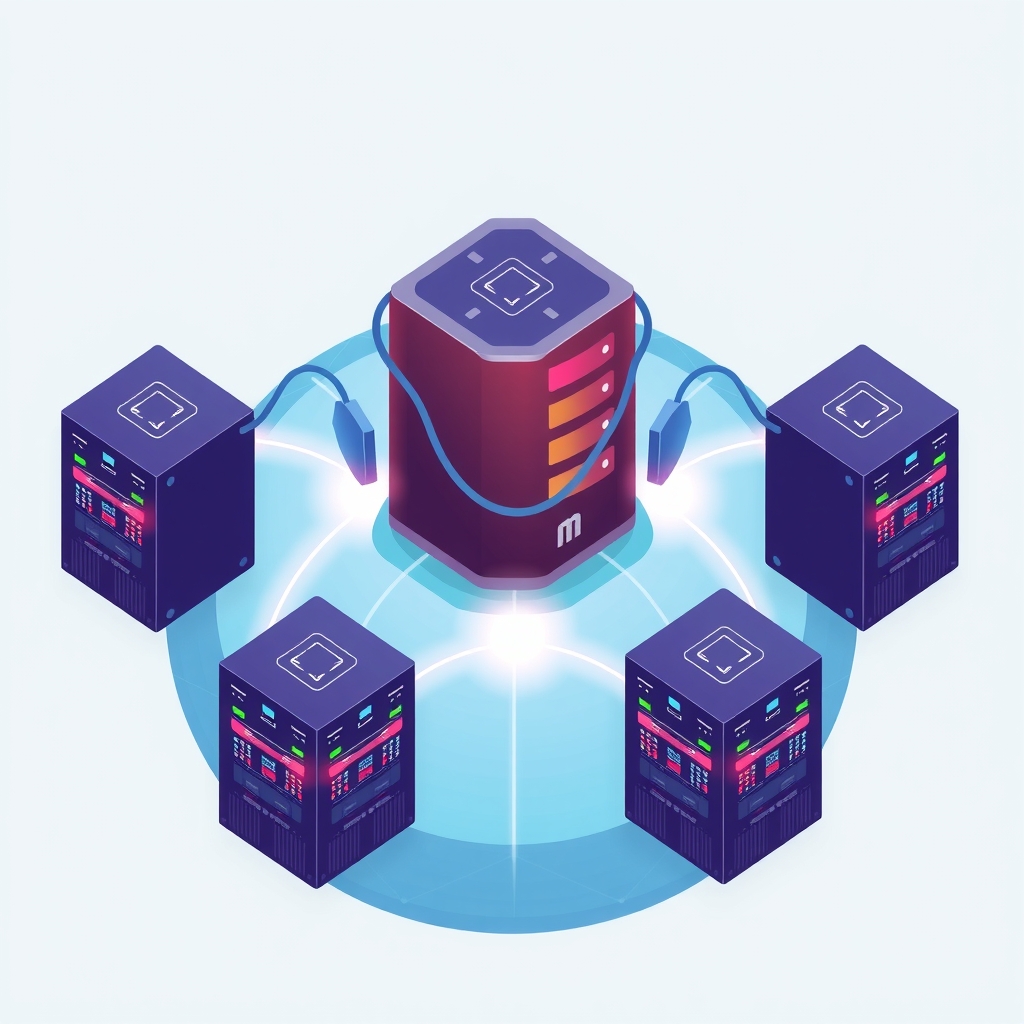
Beszel, by contrast, acts as a lightweight host monitor. It uses a hub-and-spoke architecture where a central hub collects data from agents installed on physical or virtual machines. These agents extract internal metrics directly from the Linux kernel and Docker sockets, tracking CPU load, RAM usage, swap activity, and disk I/O. This approach provides insight into resource bottlenecks that external checks might miss, such as a slow memory leak that hasn't yet caused a crash.
Experienced homelabbers now recommend deploying both tools simultaneously. Endpoint checks alone cannot warn about resource exhaustion until an application fails completely, while host metrics do not reveal if an application is throwing internal errors despite having healthy CPU and RAM levels. Running both provides a comprehensive view of both service availability and system health.
Key details
- Uptime Kuma stores configuration in a local SQLite database at
/app/data, which must be mounted on a fast local filesystem to avoid corruption from network share locking issues. - Beszel uses a secure agent model with Ed25519 cryptographic keys, ensuring that only authorized hubs can request metrics from agents listening on port
45876. - Uptime Kuma supports push monitors for cron jobs, allowing scripts to send a heartbeat via curl; if no request arrives within the window, the job is marked as failed.
- Beszel agents consume less than 20MB of RAM, and the hub idles around 50MB, making it suitable for resource-constrained environments like older mini PCs.
- Both tools require reverse proxies with WebSocket support enabled to handle real-time dashboard updates and secure SSL termination.
- Mapping the Docker socket to Uptime Kuma grants root-level control over the host, posing a security risk if the instance is compromised.
Background
Monitoring self-hosted infrastructure typically involves two layers: availability and performance. Availability monitoring checks if a service is up and responding to requests, similar to pinging a website. Performance monitoring looks inside the server to see how hard the hardware is working, tracking metrics like memory pressure and disk speed. Traditional enterprise stacks like Prometheus and Grafana can handle both but require significant setup and resources. Lightweight tools like Uptime Kuma and Beszel aim to simplify this for smaller setups, focusing on ease of deployment and low overhead.
SQLite, used by Uptime Kuma, is a file-based database that relies on strict file locking mechanisms. When stored on network filesystems like NFS or SMB, these locks often fail, leading to data corruption. This is a common pitfall for users who store all their Docker volumes on network-attached storage for convenience. Similarly, Docker socket access is a powerful but dangerous permission, allowing any container with access to control the entire host's containers.
Why it matters
For teams running their own software, blind spots in monitoring can lead to extended outages. If you only monitor endpoints, you might not know a server is running out of disk space until the database crashes. If you only monitor host resources, you might miss a situation where the web server is returning 500 errors due to a backend bug, even though the CPU usage is normal. Combining both tools ensures you catch both infrastructure failures and application-level faults.
Security is another critical factor. The article highlights the risks of exposing monitoring dashboards directly to the internet. Ports 3001 and 8090 become targets for brute-force attacks. Using a reverse proxy adds a necessary layer of protection. Additionally, understanding the permissions granted to monitoring tools, such as Docker socket access, helps prevent privilege escalation vulnerabilities in your environment.
Resource efficiency is also key for small and mid-sized companies. Beszel’s low memory footprint allows it to run on budget hardware without impacting primary applications. This makes advanced monitoring accessible to organizations that cannot afford heavy enterprise observability stacks but still need reliable insights into their infrastructure health.
What you can do
- Deploy Uptime Kuma and Beszel together using a combined Docker Compose stack to monitor both endpoint availability and host resources.
- Mount SQLite and PocketBase data directories to local filesystems only, avoiding NFS or SMB shares to prevent database corruption.
- Place both monitoring dashboards behind a reverse proxy with WebSocket support enabled to secure them and ensure real-time updates work correctly.
- Avoid mapping the Docker socket to Uptime Kuma; instead, use HTTP and TCP checks across Docker networks to reduce security risks.
- Configure Beszel agents with unique cryptographic keys generated by the hub to ensure secure, authorized metric collection.
- Use Uptime Kuma’s push monitors for critical cron jobs and backups, adding a curl heartbeat to verify successful completion.