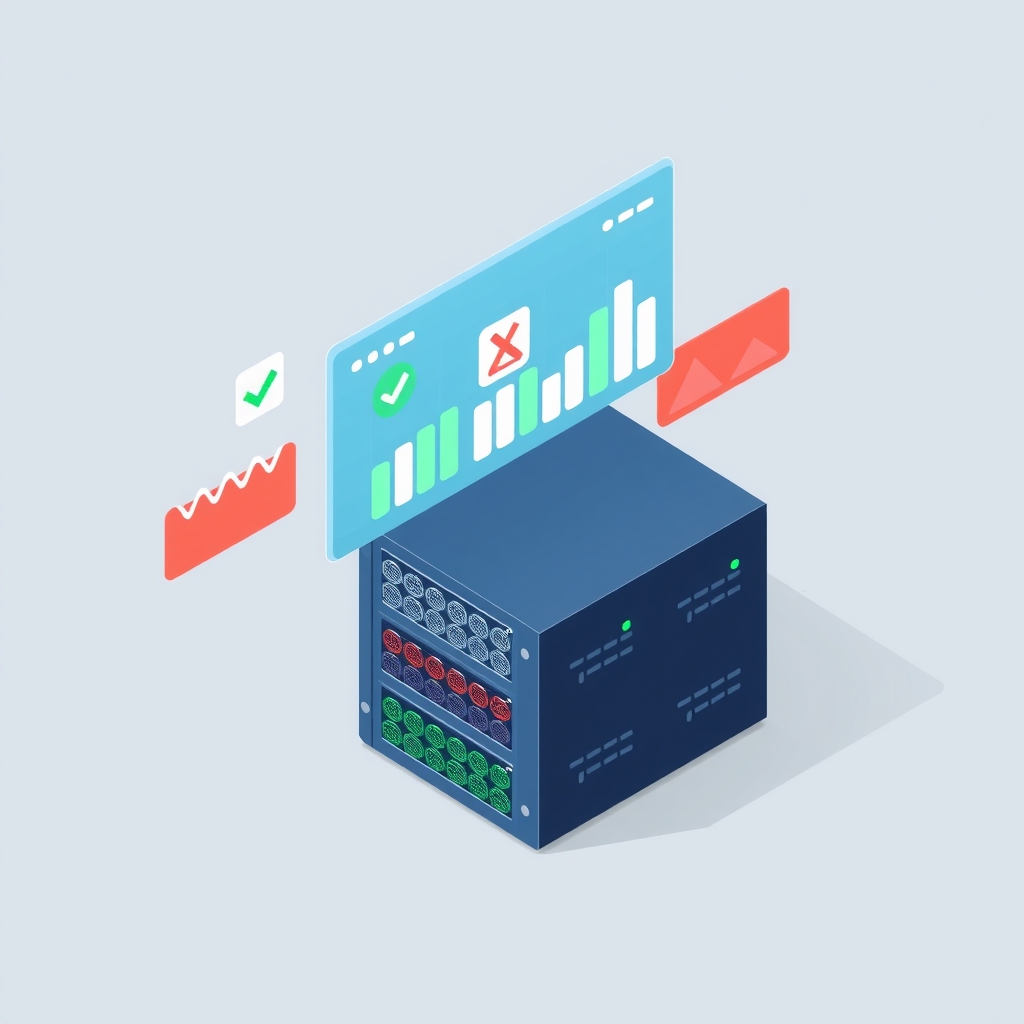
Silent server failures: why outbound heartbeats beat traditional monitoring for homelabs
A developer lost two servers to a power outage without knowing. The fix involves a dead man's switch pattern that requires no open ports.
A recent incident involving a home laboratory setup highlights a common blind spot in self-hosted infrastructure management. During a vacation, a power outage caused two servers to fail to reboot, yet the owner remained unaware of the downtime for several days. The issue was not the hardware failure itself, but the complete lack of automated alerting to notify the administrator that services were offline.
This experience underscores the difference between hoping a system works and knowing it works. Without active monitoring, silent failures can persist indefinitely, only discovered when a user attempts to access a missing service. The solution implemented by the developer took approximately thirty minutes to deploy and relies on a specific monitoring architecture suited for private networks.
What happened
The incident began with a standard residential power interruption while the administrator was away from home. When electricity was restored, the majority of the homelab infrastructure booted up successfully and resumed normal operations. However, two specific servers failed to come back online. Because these machines were not configured to report their status externally, there was no trigger to inform the owner of the problem.
The administrator only discovered the outage days later upon attempting to use a hosted service that was unavailable. This delay highlighted a critical gap in the operational strategy: the reliance on passive availability rather than active verification. In response, the developer implemented a monitoring solution based on the "dead man's switch" concept, moving away from traditional external polling methods.
The chosen approach involved using Healthchecks.io, a service that utilizes a unique architectural pattern. Instead of an external server attempting to connect to the internal network, each internal server sends a periodic signal, or "ping," to a public endpoint. If the signal stops arriving within a defined timeframe, the monitoring service triggers an alert. This method is particularly effective for homelabs situated behind Network Address Translation (NAT) routers, as it eliminates the need to open inbound ports or expose internal services to the internet.
Key details
- Monitoring model: The system uses a dead man's switch where servers initiate contact via HTTP requests rather than waiting for external checks.
- Network security: No inbound ports need to be opened on the router, maintaining the security posture of the local network.
- Configuration parameters: The setup used a five-minute check period with a five-minute grace period to account for minor network jitter or boot delays.
- Alert channels: Notifications were configured via email and mobile push notifications to ensure immediate visibility even when away from a computer.
- Scope of monitoring: The same mechanism was applied to scheduled tasks, such as backups, ensuring that silent job failures are also detected.
- Implementation time: The entire monitoring stack was deployed and tested in approximately thirty minutes.
Background
To understand why this approach is necessary, one must consider the typical network topology of a self-hosted environment. Most home and small office networks sit behind a router that performs NAT, hiding internal IP addresses from the public internet. Traditional monitoring tools often require the monitored device to be reachable from the outside world, which necessitates port forwarding. Port forwarding introduces security risks and configuration complexity, making it an unattractive option for many hobbyists and small businesses.
The dead man's switch pattern inverts this relationship. In this model, the monitored device acts as the client, sending a lightweight HTTP request to a central monitoring server at regular intervals. As long as the requests arrive on schedule, the system assumes everything is functioning correctly. If the requests cease, the monitoring server interprets this silence as a failure state. This could indicate a power loss, a network disconnect, a frozen operating system, or a crashed application. The term "grace period" refers to a buffer time allowed after a missed check before an alert is sent, preventing false positives due to temporary latency.
Why it matters
For teams and individuals running their own software, the primary value of this approach is reliability without exposure. Self-hosted environments often contain sensitive data or critical workflows, such as automated backups or media processing pipelines. If a backup script fails silently, the data loss may not be apparent until a recovery is attempted during a crisis. By attaching a heartbeat signal to the end of a scheduled job, administrators can verify not just that the server is on, but that the specific task completed successfully.
Furthermore, this method reduces the operational overhead of maintaining monitoring infrastructure. There is no need to manage a separate monitoring server, configure complex firewall rules, or maintain certificates for external access. The simplicity of adding a single command line instruction to a cron job makes it accessible to developers with varying levels of systems administration expertise. It transforms monitoring from a complex project into a trivial configuration step.
The psychological impact of knowing the system state is also significant. As noted in the source article, a homelab without monitoring is merely a hope that things are working. Active alerts provide confidence, allowing administrators to disconnect mentally from their infrastructure during off-hours, safe in the knowledge that they will be notified immediately if intervention is required. This balance between automation and awareness is crucial for sustainable self-hosting practices.
What you can do
- Identify critical assets: List all servers, virtual machines, and critical scheduled jobs that require uptime verification.
- Select a monitoring provider: Choose a service that supports the dead man's switch pattern, such as Healthchecks.io or a self-hosted alternative.
- Configure check intervals: Set realistic periods and grace times for each asset, considering boot times and expected job durations.
- Implement heartbeat calls: Add curl commands to crontabs or append them to the end of backup and maintenance scripts.
- Set up redundant alerts: Configure multiple notification channels, such as email and instant messaging apps, to ensure alerts are seen.
- Test failure scenarios: Manually stop a service or disconnect a machine to verify that alerts trigger correctly and within the expected timeframe.